The data is out. If there is still anyone out there who believes that demonetization was a well-thought out and well-planned economic policy, they are not reading the data.
Every claim that the Prime Minister and his loyal ministers made has proven to be false. The RBI Governor and ex Deputy Governor had gone on record saying that it was a "well thought out plan". This is ironic since, within the first 50 days, the RBI issued 30 circulars and notifications to address the "How to", "when to", and "why for what" issues that kept cropping up.
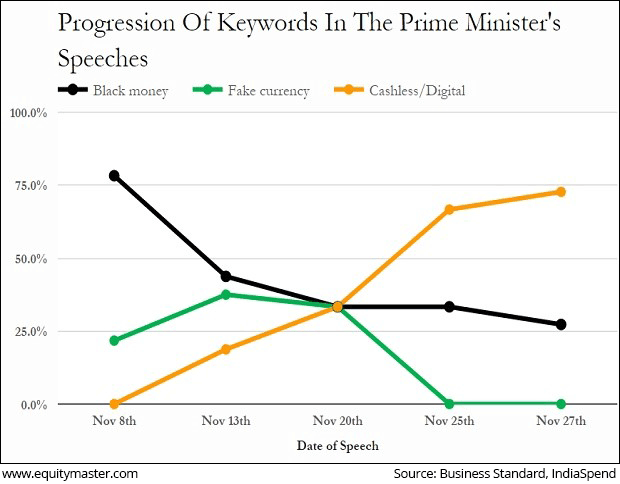
IndiaSpend tracked the usage of key phrases (Graph 1) by Modi during his aggressive national campaign in the weeks after he announced that "high-value notes" of Rs 500 and Rs. 1,000 were being eliminated in an economy that uses 98% of cash for purchase of consumer goods.
Graph 1: Cashless/digital: How Modi changed (and changed) the demonetization narrative

Initially, demonetization was sold to the public as a tool to: (i) wipe out black money, and (ii) weed out fake currency - allegedly being used by India's enemies (read Pakistan) to fund terrorism in Kashmir.
Now we know that the amount of black money that returned to the banking channels amounted to 98.96% of the high value notes. The government had spread whispers that more than half of the high value notes outstanding would be black money. Much of this would turn "white" by paying taxes and a chunk would be burnt, giving the government a windfall to spend on rural infrastructure. These statements turned out to be absolute lies or massively stupid estimates.
Table 1: Demonetization was a total failure - and some Indian lost their lives and many Indians lost their daily income.
| What was supposed to happen (Rs trillion) | RBI Data as of June 30, 2017 (Rs trillion) | |
|---|---|---|
| Total Notes | 17.0 | 17.0 |
| High Value notes | 15.4 | 15.4 |
| Genuine, "white money" deposited in banks | 6.0 | 15.3 |
| "Black money" | 5.0 | - |
| Tax @ 40% | 2.0 | - |
| % of GDP | 1.2% | - |
| Tax/GDP in India | 11% | 11% |
| Money will be burnt; windfall to the country because this debt is extinguished | 4.0 | 0.1 |
Source: Media, RBI
The second narrative was that fake currency would be eliminated and India would be safer because the misguided youth in Kashmir would not be paid Rs 500 to disrupt the peace by throwing stones at security forces. The RBI has now confessed that the value of fake currency notes was estimated to be Rs 410 million. This is 0.000027% of the Rs 500 and Rs 1,000 notes that were in circulation. So, to catch the very, very, very few who had fake currency notes, the Modi government (with not a whimper of protest from a highly compromised Reserve Bank of India, which issues the currency notes) risked the livelihoods of tens of millions of Indians and the lives of many Indians. Catchpost has documented 90 deaths as of December 9, 2016 - within 31 days of demonetization. There must have been many more.
And all for nothing: as the data indicates (Tables 2, 3, 4), there has been a spurt in border issues, mostly in Kashmir, suggesting that money is a medium of exchange and not the reason why people wage war - however, wrong that reason may be. Sadly, a 12th standard student would know that fact.
Table 2: Ceasefire violations have increased by nearly 100%
| Year | Along LoC in J&K (under control of Army) | Along international border in J&K (under control of Border Security Force) |
|---|---|---|
| 2014 | 153 | 430 |
| 2015 | 152 | 253 |
| 2016 | 228 | 221 |
| 2017 | 228* | 23# |
Source: Business Standard; Figures tabled in Lok Sabha on July 20, 2017; * Upto 11th July, 2017; # up to 30th June, 2017.
Table 3: Militant attacks on the India army are up 50%
| Year | Number of incidents | Army Fatalities |
|---|---|---|
| 2015 | 04 | - |
| 2016 | 09 | 31 |
| 2017* | 14 | 09 |
Source: Business Standard; Figures tabled in Lok Sabha on July 20, 2017; * Upto 11th July, 2017.
Table 4: Infiltration bids eliminated on LoC (Line of Control) up 30%
| Year | Infiltration bids | Infiltrators killed | Soldiers Killed |
|---|---|---|---|
| 2014 | 23 | 39 | 09 |
| 2015 | 18 | 30 | 08 |
| 2016 | 27 | 37 | 09 |
| 2017* | 16 | 36 | 03 |
Source: Business Standard; Figures tabled in Lok Sabha on July 20, 2017; * Upto 11th July, 2017; # up to 30th June, 2017.
RBI can no longer count.
As the December 2016 data rolled in and the notes were clearly heading back to the banks, the government probably got the first hint that the disastrous demonetization would be exposed before the crucial state elections in UP, scheduled for March, 2017. To ensure that the embarrassment of a failure of demonetization would not have an impact on polling day, by sheer coincidence (remember, the RBI is an independent institution) the RBI conveniently stopped publishing data on notes returned by the end of December 2016.
In what can only be cited as a "have they lost their mind?!" moment, the RBI went on record saying they ran out of note-counting machines. This from a central bank that has over USD 400 billion in fx reserves! I don't know what note-counting machines cost, but I am sure Amazon could have helped find them and delivered the machines to the doorstep of the RBI.
Meanwhile, the artful dodgers in Modi's social media brigade changed the narrative of demonetization to "making India a digital economy" (Graph 3). This caught the fancy of the urban elite and the upwardly ambitious youth in smaller towns. Smart phones are not always owned by "smart" people!
The poor who reside in villages - where the availability of banks and ATMs is far lower than a national average of one bank branch for every 9,000 people and one ATM for every 11,000 people - were still standing in line to collect usable money to survive on a daily basis. The Digital economy does not work when there is no consistent power supply. But this cashless economy narrative, too, was a failure. Data points indicate that the use of cash has clawed back to levels before the demonic demonetization.
The impact is still being felt.
For those who believe that the BJP has placed India on a take-off trajectory and have placed Prime Minister Modi on some elevated platform of solid leadership, please note these facts:
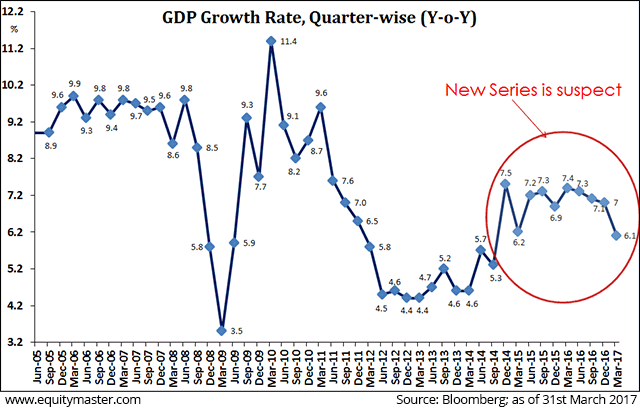
- GDP has slipped to 5.7% p.a. for the quarter ended June 2017 - this is a number that is equal to or lower than the GDP during the previous, corrupt and inefficient regime led by Prime Minister Manmohan Singh and run by the mafia of the Congress-led UPA alliance and their crony capitalists (see Graph 2); India voted the Congress thugs out of office, but the BJP has retained their dismal GDP track record;Graph 2: The recent GDP numbers have no historical comparison, but they are unimpressive and are now probably lower than what they were during the last years of the previous government, adjusted for the difference between the old and new series
- India has been a huge beneficiary of low oil prices (50% lower than during the final years of the previous UPA-2 government); the lower oil import bill and local oil subsidies have given the government an estimated 1.0% of GDP windfall annually, for the past 3 years! Yet, there is no spurt in government-backed investments;

Note: The circled number is from a changed data series starting Jan 2015
Table 5: Lowe oil prices gave India a huge leg-up - and this government wasted the windfall, so no spurt in GDP
| August 24, 2013 | May 24, 2014 | August 31, 2017 | |
|---|---|---|---|
| Party in power | Congress | BJP | BJP |
| Event | Tapering Tantrums | Modi Magic | No magic? |
| S&P BSE-30 | 18,519 | 24,793 | 31,730 |
| US$/INR | 64.01 | 58.36 | 63.90 |
| 10-Year GoI | 8.26% | 8.63% | 6.52% |
| MSCI EM ($) | 933 | 1,043 | 1,088 |
| MSCI World ($) | 372 | 418 | 478 |
| Oil ($/bl) | 106 | 104 | 47 |
| Gold ($/oz) | 1,398 | 1,293 | 1,321 |
Source: Bloomberg; as of August 31, 2017
Table 6: Government spends on poor via MNREGA will surge due to impact of demonetization because the affected poor will seek guaranteed employment
| Year ending March 31 | Spend, in INR billion | Government in power |
|---|---|---|
| 2007 | 88.2 | Congress |
| 2008 | 158.6 | Congress |
| 2009 | 272.5 | Congress |
| 2010 | 379.1 | Congress |
| 2011 | 393.8 | Congress |
| 2012 | 370.7 | Congress |
| 2013 | 396.0 | Congress |
| 2014 | 385.1 | Congress |
| 2015 | 360.3 | BJP |
| 2016 | 440.1 | BJP |
| 2017 | 579.6 | BJP |
| 2018 est | 480.0 | BJP |
Notes: MNREGA Spending figures from FY -13 onwards have been sourced from the financial statements of MNREGA website; Figures prior to 2013 have been sourced from Report to the People document for FY'14; FY '17 figures as on 30-June-2017; FY '18E total expenditure figure includes only the budgeted outlay to MNREGA scheme. Actual spends may be higher / lower depending on states own contribution.
from The Honest Truth by Ajit Dayal posted at equimaster

No comments:
Post a Comment